(By Ludmila Carone)
In the last blogpost, dear reader, you read all about what a planet transit is. (If not, then here you go!).

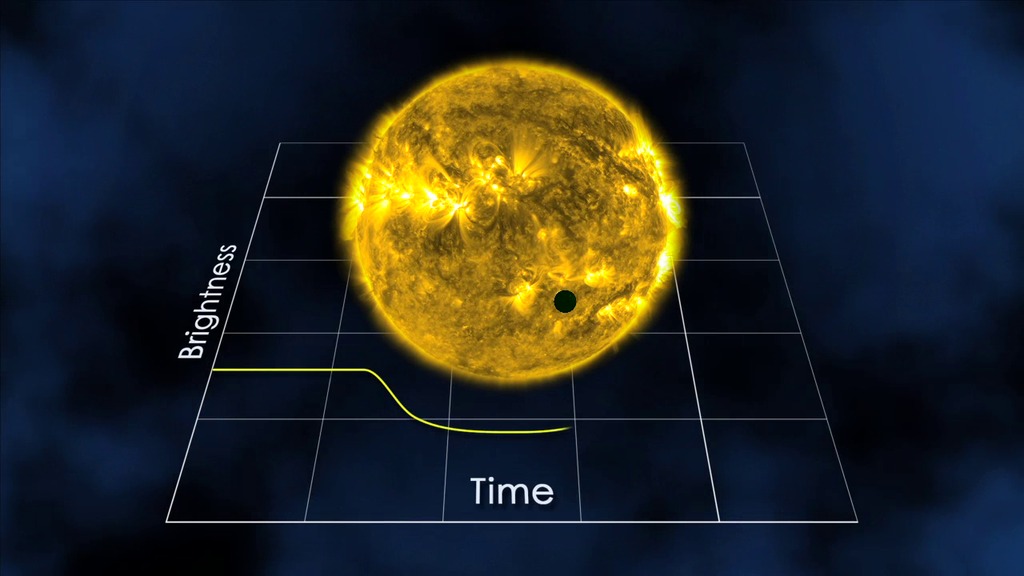
Credit: NASA/JPL-Caltech
In any case, identifying a transit is only the beginning. Now we can actually measure the transit. One of the first thing that we identify for a suspected transit of an exoplanet is its depth.
What does the depth tell us?
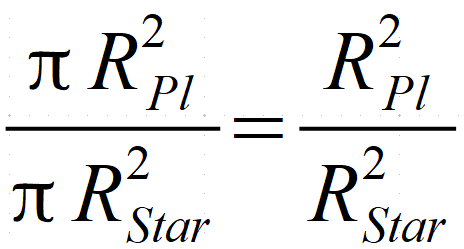
To answer this question, we have to recall that a transit is the shadow that the planet casts across the star from our point-of-view. Since we are typically very far away from both, the star and the transiting planet, we get a pretty easy formula for the calculation of the transit depth. It is just the surface area of the planet over the surface area of the star pointing towards to us. This is (with radius of planet and radius of star given):

Now let’s insert some numbers:
- A Jupiter-size planet has a radius which is roughly 0.1 R_sun. So the transit depth would be 0.12=1%
- An Earth-size planet has a radius, which is roughly, 0.01 R_sun. So the transit depth would be 0.012=0.01%
- The famous TRAPPIST-1 System has at its centre a red M dwarf star with roughly R_star about 0.1 R_sun. So here, an Earth-sized planet is only 10 times smaller than it’s host star and we have again a transit depth of 0.12=1%
So, here, dear reader, you see one of the reasons why the exoplanet scientists are so crazy for rocky planets around M dwarf stars. It is easier – by a factor of up to 100 – to detect them. That’s a lot!
And to give you a feeling for the accuracy you will need to measure a drop in brightness of 1% and less, I show you now some real data:
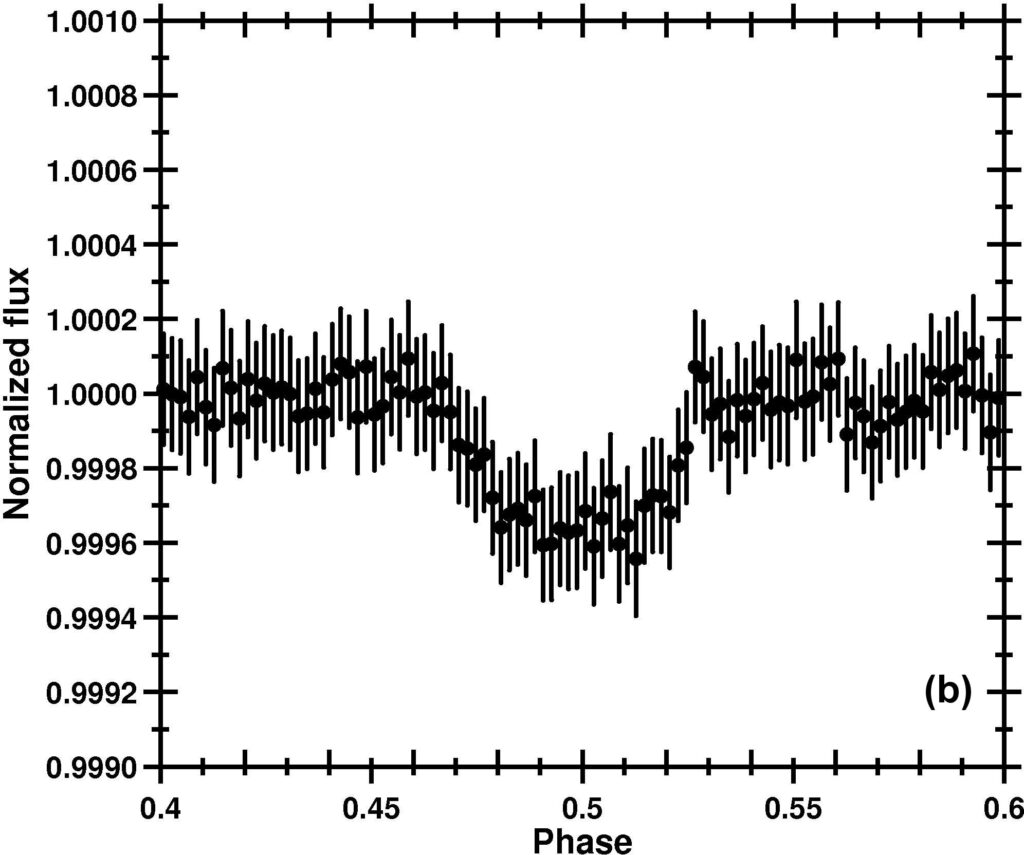
Here are for example, several transits of CoRoT-7b the first rocky exoplanet discovered with the transit method lumped together.

Credit: (L.Carone/CNES/CoRoT) From my old days of CoRoT exoplanet detection. Look at the scale of the thing! A transit depth of roughly 0.0003. This turned out to be an 1.58 Earth radius planet. We call such an object a Super-Earth.
Here, we monitored the star CoRoT-7 and kind of suspected that a planet is casting its shadow. We thus cut the stellar brightness monitored in time into regular pieces. In each piece we should find one single “transit snapshot”. We also adopted for the width of the snapshot the suspected orbital period. And then we stacked all these pieces on top of each other. This is called a phase-folded lightcurve and is shown above. The idea is that if you have “hit” the correct orbital period (or a multiple of it), the transit signal would be clearer, the more “transit snapshots” you stack on top of each other. If there is no repeated transit than you should get a more or less flat line (1).
And this was CoRoT, which was not as accurate as the Kepler space mission.
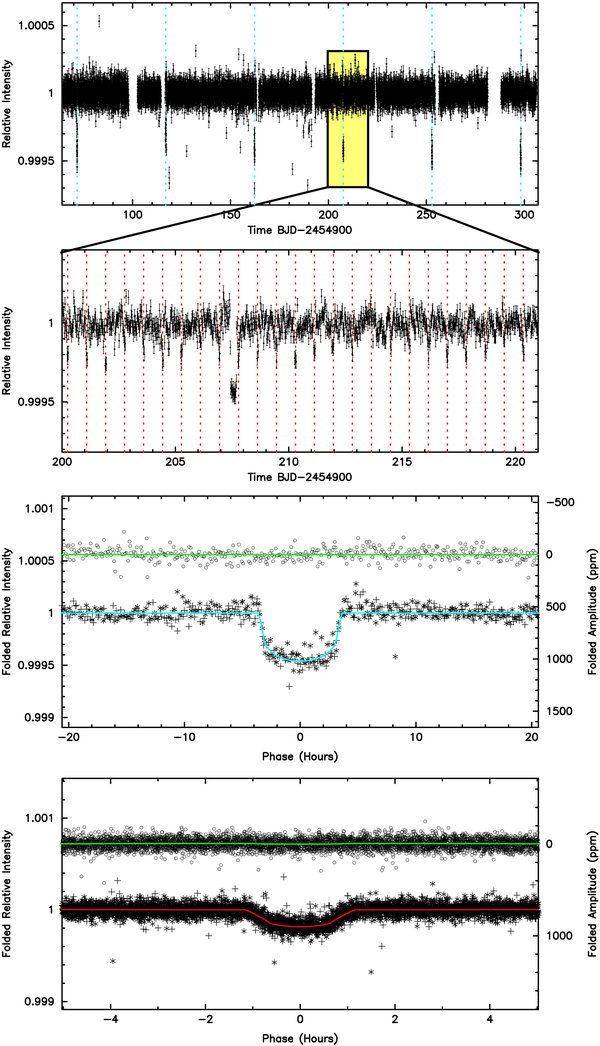
So let’s have a look at Kepler-10b, the first rocky exoplanet discovered by this space mission:
Credit: Bathalha et al. 2011. (top: a cleaned stellar brightness monitoring curve covering 300 days. Second from top: A 20 days cut-out of the above. See the weird spikes that you see in the top two panels? That’s a transit of the rocky Kepler-10b. You can see it by eye! The bottom two panels are phase-folded light curves. The second panel from the bottom is obviously also in addition binned. Binning means that you in addition average out some points. )
This paper is now almost 10 years old. But it really drives home how accurate Kepler was and what kind of leap it was for exoplanet science. For the CoRoT space mission, astroseismology was the main science goal. Exoplanets were added relatively late in the mission design. Kepler, on the the other hand, was a dedicated exoplanet hunter.
And it revolutionized the field by discovering many, many exoplanets and by measuring the transit depths and thus the planet sizes with unprecedented accuracy.
_________________________________
(1) I mean, if a planet is there, it is going to be very regularly going around its star and cast a shadow. It is not going to randomly go away and play hide-and-seek with the astronomers. The star may act a bit like a jerk though and vary its brightness by 1% and more. Then things can get actually a bit tricky.
